There is nothing special about the “inconsistent” state, it just means that the previous update did not finish successfully, and that the Update Module does not provide rollback. Deploying with Mender works exactly the same way afterwards.
If it’s not working for you, then it’s likely that the failed deployment broke the installation somehow. Perhaps connectivity was affected, or ability to install new files. Your best bet is probably to look at the log of the failed deployment to try to figure out what went wrong in the first place.
Yes, I understand your key points, I have deployed one release and its failed\aborted, and its a new release, and now I’ll share the deployment log here, so that you can get some idea, becuase I have tried and this aint happening, Im not able to deploy any other releases becuase the device isn’t syncing anymore after a failed\aborted deployment, I(maybe the previous release was inconsistent, I dont knw)
FYI: I know its strange, but there gotto be a prblm somewhere,
(Its .log format, but to upload I have changed to .yaml)
After I start my demo server (sudo ./demo up), then when I press “enter” for logs, I get storage-proxy error, Is it because of this this entire thing is happening to my server?
The solution which I have is to reboot the device manually, so that device is synced again to mender and redeploy or deploy new artifact, but again , a very unlikely situation in production.
I think this issue isn’t reported by anyone, But i would love to resolve this. Mender looks very promising and Im sure something is wrong which can be corrected.
Yes, It could be the cause of the deployment error, But In case this happens, How to we rollback to the prevous state and also reboot, so that I can redploy it again. I know script module doesn’t support rollback and reboot. But if you have any example or even how to include these two in script module, it will be great.
I would really like to have these two artifacts added to the script module?
Hi, I’m writing again to this issue because unfortunately, Im having same lag but now Im using a production server, It was fine until I onboarded 5 devices, Same lag between different tabs, and Im getting 300 request in 5 min when I inspect device tab.
This is what im facing, I knw it shouldnt happen, but it is actually bit slower even in production server, the server has 16gb ram, and it isnt using any. Do u think it has anything to do with my Computers RaM performance? cuz its the chrome browser
I am sorry to hear this happens again. Could you provide screen shots form the device view from your browser?
could you also send the logs form the deviceauth, inventory and mongodb containers?
if there are some confidential materials there, please send them via email to support@mender.io
Some additional questions, if you could take a look at them:
how are you connecting to the server?
where is it located with the relation to your desktop?
could you try a different machine? perhaps run a web browser remotely “closer to the server”?
what happens when you reload without cache (command/control+shift+r) and run from the incognito window? how long until you see that behaviour?
have you tried restarting Mender? does it change anything?
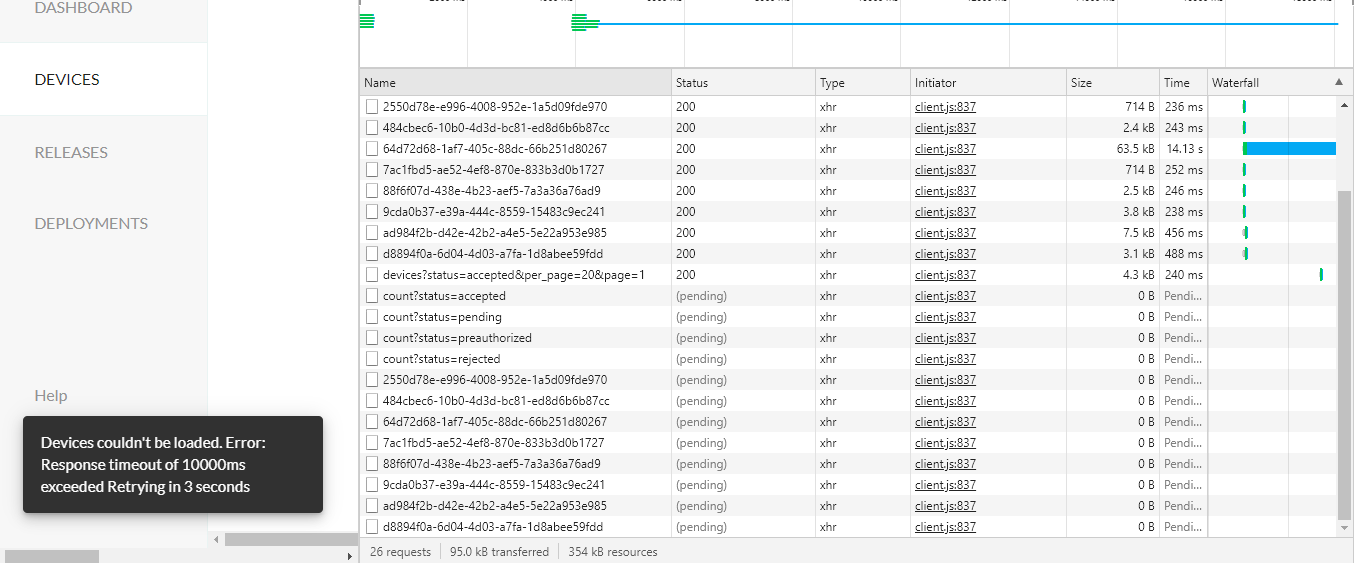
@nishad1092 can you please verify if the issue is in the UI or in the API calls? You can use the Chrome Developer tools to get a curl command for one of the API calls (e.g. the one calling devices/count) and try to execute it from your console. In this way, we can understand if the issue you are facing is because the UI is sluggish, or if is the backend which is slow in answering your calls.
thanks. restart: just stop with: ./run down -v and then start, check ./run ps or docker ps to see that all containers are gone before running ./run up.
one more thing: could you run nice -n 8 top -d1 on the server machine, while you are experiencing “sluggish ui” effect? do you have sysstat package configured and installed? could you try to access mem/cpu/diskio statistics during the ui session that is showing slow behaviour?
Thank you for your response.
But then if I do ./run down -v , won’t this command erase the existing data from server. So instead isn’t it ./run stop ??
Sure I’ll also checck with nice -n 8 top -d1 on the server machine once.
Thank you for ur response…
I don’t think there is any issue when there is API call. Calls are happening well. But the UI is sluggish. I do have only 3 devices now, But many devices I decommisioned and rejected, do u think the cache or the old data is causing the issue?
Is there a way to clear the old data of decommisioned or rejected devices?
Hi @tranchitella, Yes I tried from Incognito and also from another computer, but the problem persist. But let me try restarting and also the top command which @peter told me while the UI hangs.
It is a server in Azure, and it has 4 vCPUS and 16Gb RAM, so the memory usage, network usage looks fine all the time. It hasnt hit the peek even when the UI is sluggish…I’ll again loook into it but this is what I found. And then I’m my laptop’s chrome browser to login to Mender server.
Considering the similarity with your previous description I could still use the the full body for the device list request (devices?status=accepted&per_page=20&page=1 + the ones with the UUID), better yet the entire response to say anything more specific. And the device intervals from the devices.
If there is anything confidential/ sensitive in these responses, feel free to send them in a private message…